


-
1
-
2
-
3
-
4
-
5
해당 자료는 1페이지 까지만 미리보기를 제공합니다.
1페이지 이후부터 다운로드 후 확인할 수 있습니다.
1페이지 이후부터 다운로드 후 확인할 수 있습니다.


목차
1. Introduction
2. Analysis for Individual stocks
3. Portfolio Analysis
4. Conclusion
2. Analysis for Individual stocks
3. Portfolio Analysis
4. Conclusion
본문내용
1. Introduction
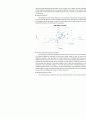
Our group has interest in the performance of stocks of Korean company in US stock market. In order to analyze it, we selected five Korean companies listed in NYSE (see Exhibit 1) and gathered their monthly stock prices and returns data. Our objects are to make an analysis for the performance of individual stocks and portfolio and to find the best regression model for forecasting. OLS method is to be used for simple and multiple regressions.
2. Analysis for individual stocks Descriptive statistics
During the 5-year period from 2002 through 2006, all five stocks outperformed S&P 500 index. However, when we look at the graph we can find that each stock has had higher volatility than S&P 500. It is interpreted that each stock yields returns higher than market average and thus is suitable for long-term investment, but might be riskier in short-term.
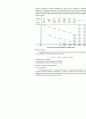
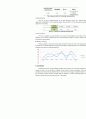
The following table shows the distribution of monthly returns of individual stocks. Benchmark is S&P 500 index, of which distribution is bell-shaped. On the other hand, individual stock returns are dispersed over a wider range. See Exhibit 2 for the detailed descriptive statistics.
Covariance and Correlation (see Exhibit 2)
According to covariance and correlation matrices, no pair of different stocks shows strong correlation. Instead, all stocks have positive correlation with each other, within a range between 0.30 and 0.58.
Regression for Beta (see Exhibit 3)
It is revealed that S&P 500 index is not a good variable for explaining the performance
Our group has interest in the performance of stocks of Korean company in US stock market. In order to analyze it, we selected five Korean companies listed in NYSE (see Exhibit 1) and gathered their monthly stock prices and returns data. Our objects are to make an analysis for the performance of individual stocks and portfolio and to find the best regression model for forecasting. OLS method is to be used for simple and multiple regressions.
2. Analysis for individual stocks Descriptive statistics
During the 5-year period from 2002 through 2006, all five stocks outperformed S&P 500 index. However, when we look at the graph we can find that each stock has had higher volatility than S&P 500. It is interpreted that each stock yields returns higher than market average and thus is suitable for long-term investment, but might be riskier in short-term.
The following table shows the distribution of monthly returns of individual stocks. Benchmark is S&P 500 index, of which distribution is bell-shaped. On the other hand, individual stock returns are dispersed over a wider range. See Exhibit 2 for the detailed descriptive statistics.
Covariance and Correlation (see Exhibit 2)
According to covariance and correlation matrices, no pair of different stocks shows strong correlation. Instead, all stocks have positive correlation with each other, within a range between 0.30 and 0.58.
Regression for Beta (see Exhibit 3)
It is revealed that S&P 500 index is not a good variable for explaining the performance
키워드
추천자료
 청소년의 여가활동 실태분석및 문제점과 해결방안
- 스포츠스타 광고모델의 광고효과분석
- spss를 이용한 실업난 원인분석과 정책방안에 대한 연구
- 유한양행 경영 분석
- 우리나라 고등교육시장의 경쟁구조 분석과 전문대학에 대한 평가
- MP3 이용 실태에 관한 자료분석
- 데이터 마이닝 분석기법
- 농산물가격론(고구마의_수요와_가격에_대한_분석)
 저출산문제에 대한 데이터 마이닝 분석
- 겟잇 뷰티 스타뷰티쇼 프로그램 비교분석
- 청소년 학업성취에 미치는 영향요인 분석
- [상담심리학 공통] 정신분석적 상담이론, 인간중심 상담이론, 게슈탈트 상담이론을 비교·설명...
- 설문자료 통계 분석 레포트
- 가격2,500원
- 페이지수5페이지
- 등록일2010.01.14
- 저작시기2008.7
- 파일형식기타(docx)
- 자료번호#574286

본 자료는 최근 2주간 다운받은 회원이 없습니다.


소개글